[ad_1]
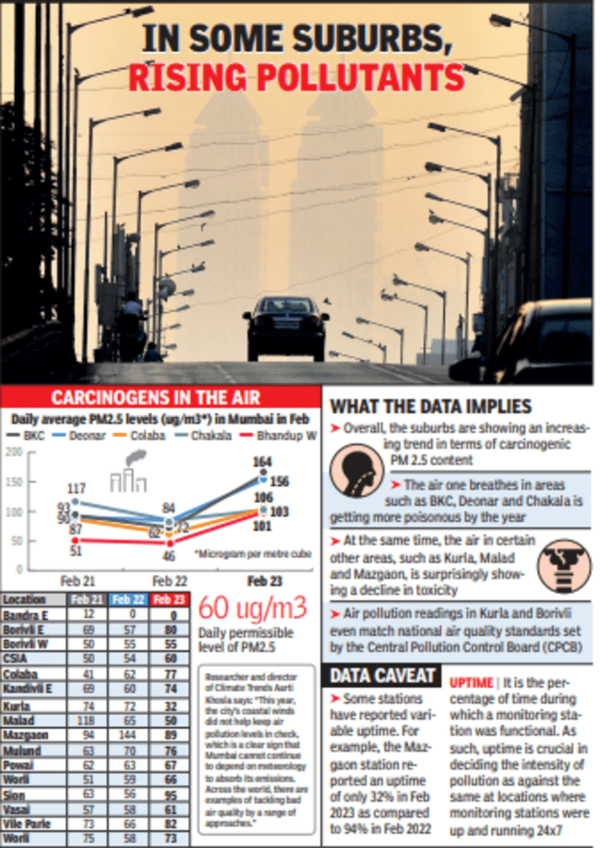
In fact, there were zero “good air” days-average PM2.5 levels under 30 ug/m3-in February, shows data from the National Clean Air Programme.
Track the pollution level in your city
But some places were significantly worse than others. PM 2.5 levels almost or more than doubled in BKC, Deonar, Bhandup (Khindipada) and Sion in February compared to last year.
Posh BKC breathing poison, just like several key city hubs
Suburban air quality has shown a steep decline. BKC saw 15 ‘very poor’ and two ‘severe’ air days, while Deonar saw 26 ‘very poor’ air days this February. Colaba, CSIA, Mulund, Powai, Worli and Kandivli-E also saw increases in PM2.5 levels, though less sharp, in the same period.

PM2.5 refers to fine particles that slip into the lungs easily and cause multiple health problems, including cancer. These are some of the trends revealed by NCAP Tracker, a project by Climate Trends and Respirer Living Sciences, that compiles and evaluates air quality data and tracks clean air policy. NCAP refers to the government of India’s National Clean Air Programme.
Air quality analysis shows an increasing trend of PM2.5 levels in 16 of 21 monitoring stations, especially in the suburbs. The trends are “alarming and need immediate attention from both monitoring and mitigation perspectives,” said Ronak Sutaria of Respirer. Added Aarti Khosla of Climate Trends, “A deep dive into data shows us several locations need focused action as levels are above average.” In all, 17 monitoring stations had a monthly average higher than CPCB’s prescribed safety limits for the coastal city.
Only three monitoring stations recorded PM2.5 levels within the permissible limit of 60 ug/m3 in February, the analysis found, including Kurla, Borivli-East, and Malad.
Kurla and Malad, along with Mazgaon, actually saw improvements in PM2.5 levels. However, the Mazgaon air quality monitoring station reported an “uptime” of only 31.96% in February 2023 as compared to 93.68% in February 2022, said the report.
Uptime is the percentage of time during which a monitoring station remains functional. The Kurla monitoring station had an uptime of 92.75% the same month.
All 21 monitoring stations reported data with an average uptime of 80.5% in February 2023. The average PM2.5 levels for all stations was 83.41 ug/m3, considerably higher than the previous year.
“This year, the city’s coastal winds did not help keep air pollution levels in check, which is a clear sign that Mumbai cannot continue to depend on meteorology to absorb its emissions,” said Khosla. Mumbai should implement sensor-based monitoring and develop control strategies across sectors like industry, power, transport, and construction to reduce emissions at source.”
[ad_2]
Source link


Join The Discussion